OEE As Your New ROI Standard In Pharma Manufacturing
OEE As Your New ROI Standard In Pharma Manufacturing

Olga-Maria Plessa
Product Owner / Lead Consultant
Return on Investment (ROI) has traditionally been the main driver for investments worldwide. Executives in pharmaceutical manufacturing have been utilizing ROI to evaluate and justify investment decisions. But how can the ROI of pharma manufacturing capital investments be calculated? How can a manufacturing analytics system be integrated into financial analysis to attract the CEO’s attention?
OEE (Overall Equipment Effectiveness) has been used so far primarily as a manufacturing Key Performance Indicator (KPI). With OEE, loss analysis can be performed paving the way for root causes to be detected, and production improvement actions to be taken, but can OEE also be used to provide financial insights that drive investment decisions?
What Is Overall Equipment Effectiveness?
Overall Equipment Effectiveness or OEE is a ratio of how well a pharmaceutical manufacturing facility is utilized compared to its scheduled output. It is a conventional manufacturing metric that measures the volume and quality of production compared to the total production. OEE takes into account various key elements of the manufacturing process that reveal the unscheduled downtime, the operating time frame, and the relative impact of minor stops and rejections.
How Is Pharma OEE Calculated?
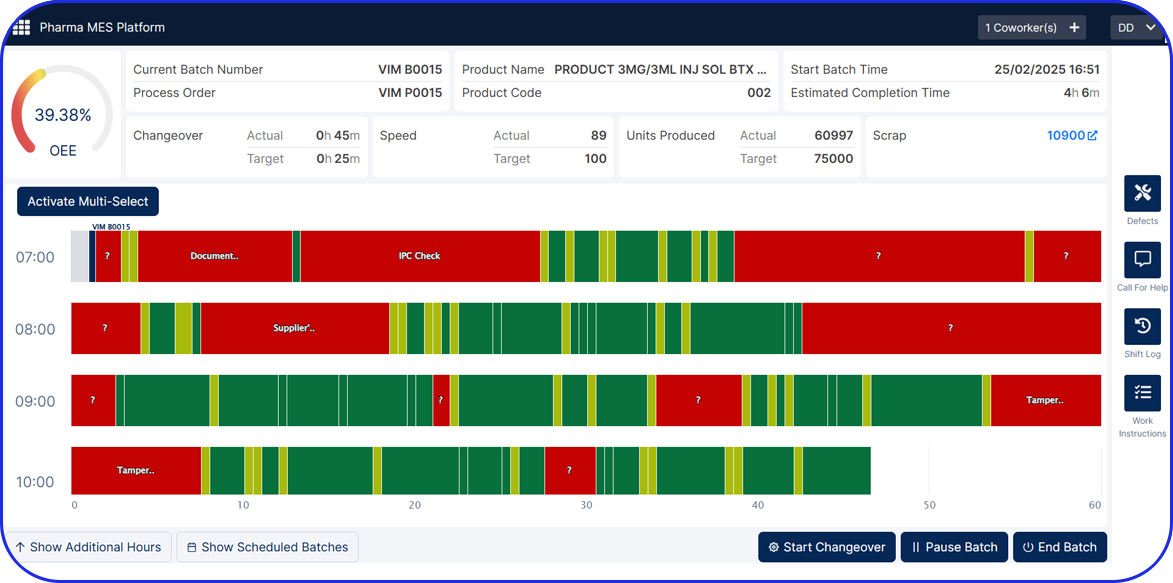
OEE is measured based on availability, performance, and quality. Available time means uptime. This is the total scheduled production duration minus all planned and unplanned interruptions during the manufacturing process. Performance measures the effect of the average actual speed versus the target / validated production speed of a product. Quality measures how many items passed quality testing the first time compared with the overall number of products produced.
In other words, it is a measurement of productivity that calculates the efficiency at which equipment produces finished goods by considering the three fundamental calculations:

Overall Equipment Effectiveness (OEE)
Availability
Availability [A] is the percentage of planned production time that can be allocated for manufacturing or, in other words, the percentage of scheduled time that the production line is available to operate versus the total scheduled time. The losses in this category are unplanned and planned stops of all kinds.
Performance
Performance [P] is the actual throughput of the line during the time it runs, divided by the maximum throughput that it would have achieved by running at the validated speed. We categorize losses as rate loss, which includes reduced speed either under normal operation or during the ramp-down and ramp-up phases associated with every stop, leading to slow cycles.
Quality
Quality [Q] is the quantity of actual production output that meets customer specifications and has no defects (good units) on its first pass through a line (first pass yield) compared to the total produced products, including rejections and reworks.
You can find more information here on what is OEE and why it is important to pharmaceutical manufacturing.
How Can OEE Increase Financial Performance?
Let us use as an example a Solid Dosage Forms (SDF) contract manufacturing organization (CMO) that has a total of 7 packaging lines that produce on average 300 cartons per minute which equals 300 cartons x 60 minutes = 18.000 cartons/hour. And let us assume that each secondary packaging line operates 5 days per week for 24 hours per day (3 working shifts). This would mean that each packaging line operates 5 days x 24 hours = 120 hours/week and, assuming 50 working weeks per year, for 6.000 hours/year.
Now, to calculate the output produced per year, we will multiply the machine runtime in hours with the units produced per hour times the overall equipment effectiveness (OEE) of the packaging line.
Assuming the current OEE of the secondary packaging line is 35%, the packaged cartons in a year would be 6.000 x 18.000 x 35% = 37.800.000 cartons/year.
In the event of a 10% increase in OEE (38.5% OEE), the produced output in a year would now be 6.000 x 18.000 x 38,5% = 41.580.000 cartons/year.
41.580.000 – 37.800.000 = 3.780.000 cartons
So a 10% increase in OEE would result in 3.780.000 additional cartons per packaging line, so a total of 3.780.000 cartons per line x 7 lines = 26.460.000 additional cartons.
Assuming an estimated 0.50€ profit per carton, then a 10% increase in OEE would result in 24.460.000 cartons x 0.5€ profit per carton = 13.230.000,00€ in incremental profitability.

Profitability linked to OEE manufacturing KPI
How To Achieve An Increase In OEE?
1. Establish a Baseline for OEE
Before embarking on OEE improvement, it’s crucial to determine your current OEE to set a benchmark. This baseline will help identify areas where improvement is needed and allow you to measure progress over time.
2. Real-Time Metrics & Loss Analysis
Utilizing real-time OEE metrics and loss analysis is key. These metrics, when displayed on the factory floor alongside other KPIs, empower your team to make better operational decisions. However, simply measuring productivity isn’t enough – it’s the basis that points problem-solving efforts in the right direction. By identifying losses early, attention is directed to areas where improvement can have the most significant impact.
3. The Role of Manufacturing Analytics & OEE Solutions
Manufacturing Analytics and OEE solutions are pivotal in identifying optimization opportunities. These solutions rely on Industrial Internet of Things (IIoT) based edge devices to track key production data such as line speed and machine performance in real time. This data can then be used to:
• Identify bottlenecks: Discover the root causes of machine stops and inefficiencies.
• Increase operator awareness: Provide operators and supervisors with instant visibility into line and shift performance.
• Monitor production cycles: Track the time, output, and performance of each production cycle.
• Compare batches & SKUs: Analyze the performance of different production runs for deeper insights.
• Analyze scrap & rework: Measure first-pass yield and the impact of rework on quality.
4. Immediate Gains with Quick-Win Improvements
Collecting and analyzing IIoT data from Manufacturing Analytics & OEE solutions will provide actionable insights that allow for quick-win improvements. These improvements often require little to no capital investment but can deliver high returns, leading to increased OEE. Over time, these initial gains can justify further investments in larger-scale improvement projects.
5. Unlocking Long-Term Financial Gains
By leveraging the right set of tools and data, organizations can unlock previously hidden opportunities for both operational efficiency and financial growth. From reducing machine downtimes to optimizing product quality and minimizing waste, OEE optimization creates a pathway for continuous improvement.
OEE As The New ROI Standard In Pharma Manufacturing
We now know that OEE can be used as the currency of proof to allow manufacturing companies to drive financial decisions. By dividing the total yearly profit by the OEE percentage, we can extract the worth of each percentage point increase in OEE. This is a powerful way to know the exact profit that will be obtained from each investment.
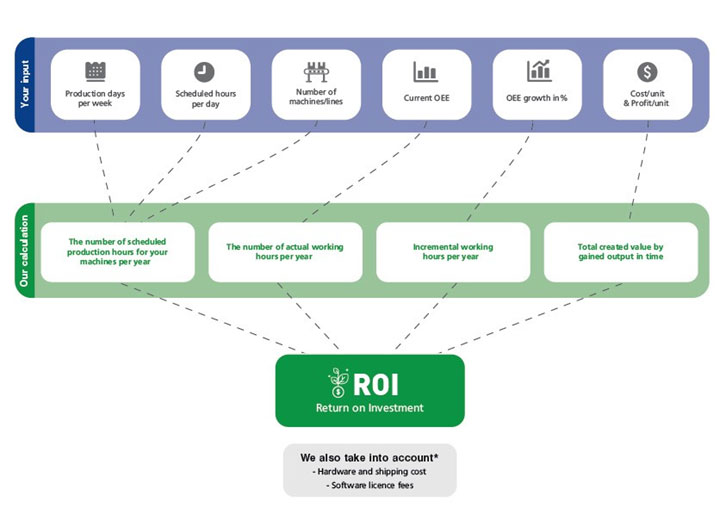
OEE & financial metrics linked to drive ROI
If, for example, one production line of your pharmaceutical / biotech manufacturing facility generates 10€ million of profit each year and has an OEE of 35%, you would divide 10.000.000 / 35 = 285.714,28€.
In this example, each percentage point gain in OEE is worth 285.714,28€ in profit.
The first step is to determine the value of OEE, and then you can optimize your processes and turn those potential gains into reality. In the above example, with a boost in OEE from 35% to 45%, your profit will grow from 10.000.000€ to 12.857.142€.
With Vimachem’s Manufacturing Analytics & OEE solution, even a 1% growth in OEE (from 40% to 41%) would result in an 8054% ROI.
Do not hesitate to invest in the implementation of an IIoT-based software application that will help you gain real-time insights to control and optimize your OEE, leading to significant financial gains.
If you can’t measure it, you can’t improve it.
Lord Kelvin
Ready To Augment Your Shop Floor Operations?
Ready To Augment Your Shop Floor Operations?
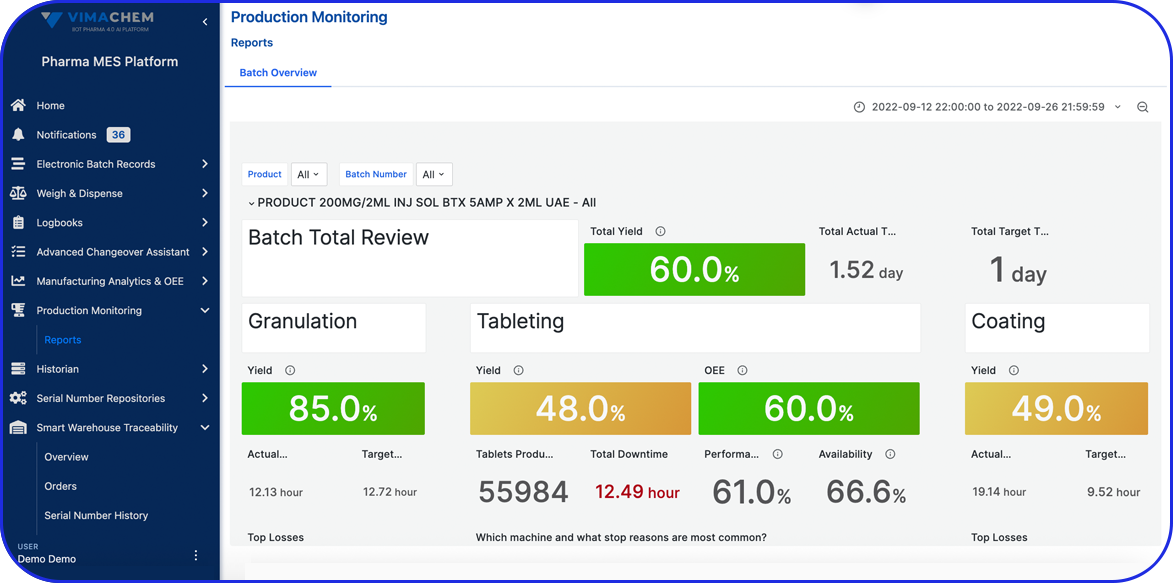
Vimachem Manufacturing Analytics - OEE
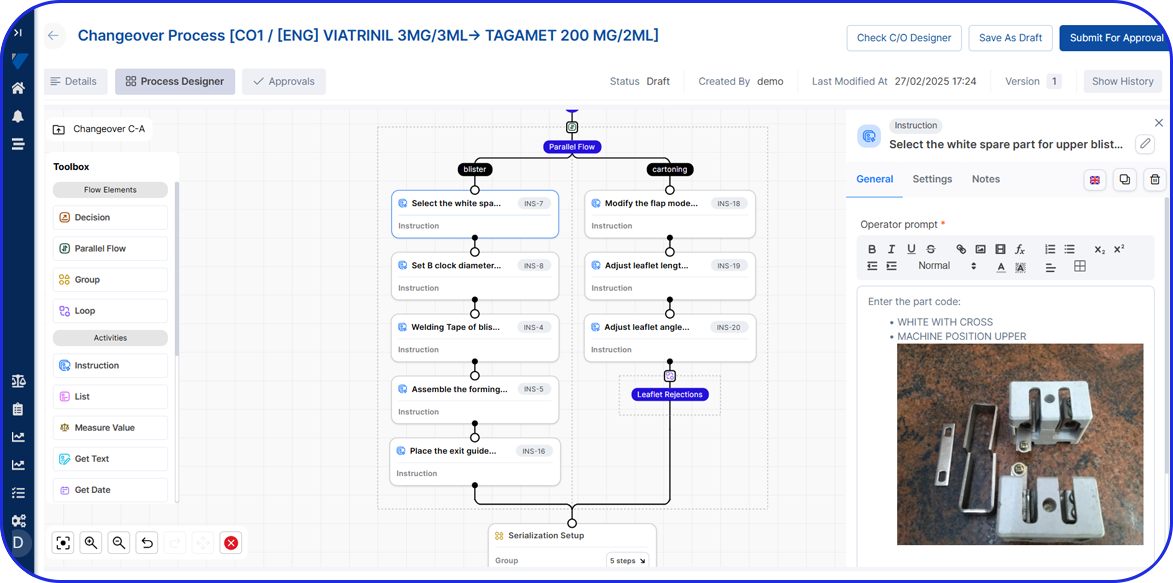
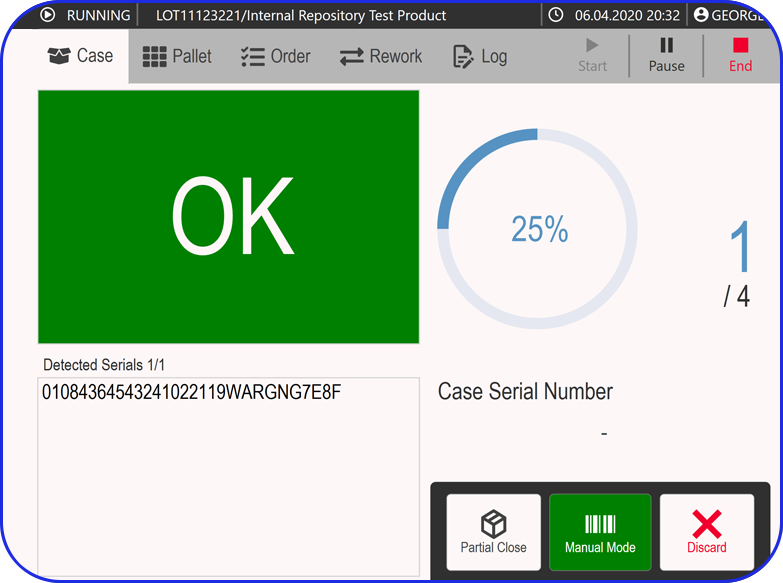
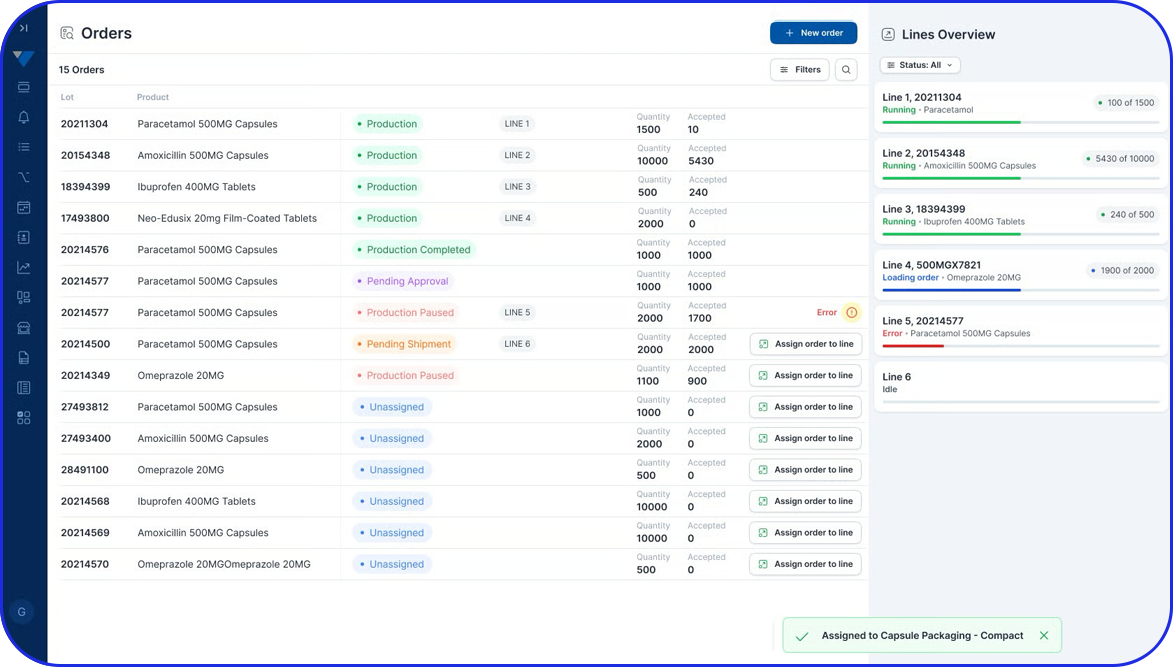
The Manufacturing Analytics – OEE module is an intelligent Pharma OEE Cloud solution that allows you to collect, store and visualize data across your site / enterprise and apply AI algorithms to optimize production efficiency and product quality.